


Freight railcar fleet management service
Logistics specialists find and allocate freight railcars in a single interface, while managers keep track of fleet utilization and idle time

Project at a glance
Logistics specialists managed the list of freight railcars in an Excel file with macros. They received the plan and requests in 1C (ERP/accounting), updated the spreadsheet, set up filters and matched data from other systems. Railcar search and allocation had to move into a web app, cutting down on repeated data entry. The manager needed an overview of fleet utilization and idle time without having to ask the logistics specialists for it each time.
- Railcar search and list filtering
- “All” and “Needs allocation” modes
- Station and customer assignment with data validation
- Saving, editing and applying presets
- Move railcar search and allocation from Excel to a web app
- Reduce data re-entry when assigning railcars
- Give the manager self-service access to fleet metrics
Want the same for your business? Tell us about your task — we’ll propose a solution and estimate the timeline.
Railcar search and allocation
We built a working list with search by railcar number, station and customer. Filters narrow down the selection, and the “Needs allocation” mode brings up the railcars that need an assignment.
A logistics specialist selects railcars and assigns them a station and customer through a form that validates the input. Search and assignment share one interface, so data doesn’t have to be copied by hand between a working spreadsheet and a form.
Recurring search criteria can be saved as a preset and applied again. The list offers personal and team presets, so a frequent search doesn’t require setting up filters from scratch.

Fleet utilization and idle time
For the manager, we built a dashboard that brings together the total fleet, railcars in service, available railcars and idle time. A utilization chart shows how the share of railcars in service changes over a selected period.
Long idle periods and their estimated cost by railcar type are shown separately. Period comparisons and alerts help spot changes, and links to the list open the railcars that need attention. The manager sees the big picture without a separate report from the logistics specialists.

Data from external systems
We connected 1C and ETRAN (the Russian Railways e-waybill system) so data from these external systems can be used in the web app.
The interface shows when railcar location data and 1C data were last updated. A logistics specialist can check that they are current before picking railcars.
Technical details
Technical details
The project runs on Bitrix deployed in Docker. Filtering and the basic dashboard rely on a local database with synced data, with no direct queries from the interface to external systems.
Target audience
- Logistics specialists
- Heads of logistics
What users need
Job to be done — from situation to outcome
I received the plan and requests in 1C, updated an Excel file with macros and matched data from other systems. For frequent searches, I had to set up the criteria again and copy data by hand.
I want to allocate railcars with less repeated work and less risk of making mistakes when transferring data.
I work with the data for picking and assigning railcars in one interface. I reuse saved presets and depend less on the Excel file and its macros.
What’s inside
Railcar search and list filtering
“All” and “Needs allocation” modes
Station and customer assignment with data validation
Saving, editing and applying presets
Dashboard of fleet utilization and long idle periods
Utilization chart and period comparison
Idle-time cost estimate by railcar type
1C and ETRAN integration
Data update timestamps
How we worked
Analysis of how logistics specialists worked in Excel
Building the railcar list, search and filters
Implementing assignments and saved presets
Creating the fleet management dashboard
Connecting 1C and ETRAN
Need a similar project?
Tell us about your task — we’ll estimate the scope, timeline and cost and propose a solution.
Other projects
See all projects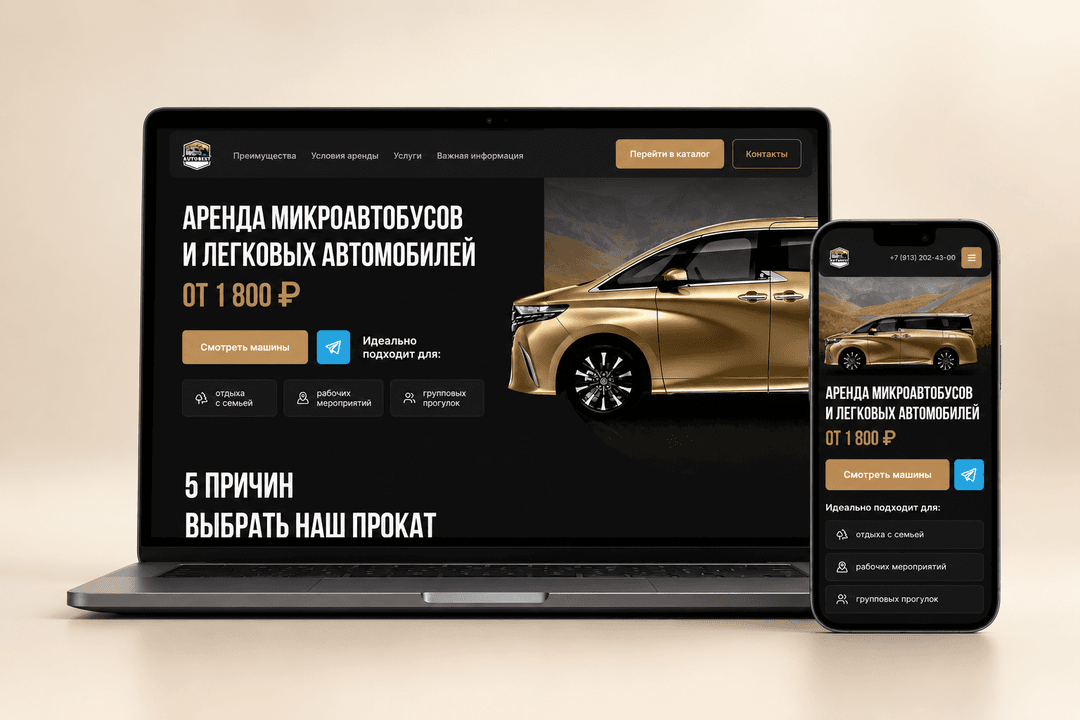
A website for a Novosibirsk car rental company, with a catalog for comparing cars by price and seating on desktop and mobile

The CRM helps the company and its partners manage bankruptcy cases, collect client information and request legal support
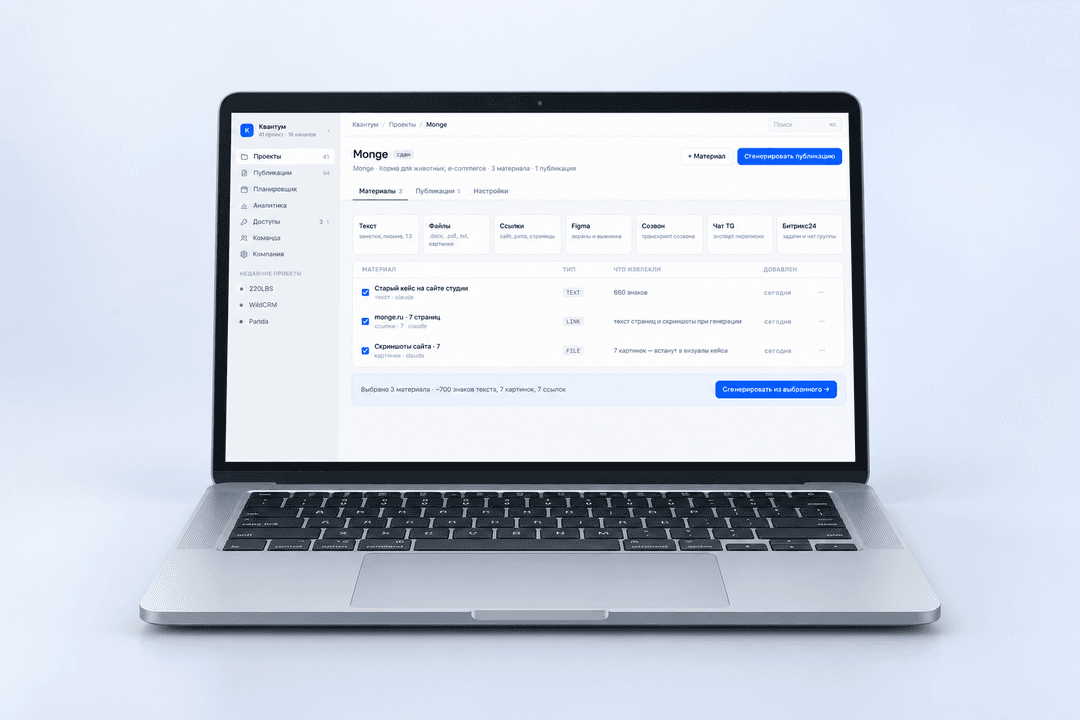
The service gathers project materials into an editor-approved dossier, prepares case studies and posts for different platforms and publishes them on schedule