


Analytics for marketplace sellers
Client: WildCRM
WildCRM helps sellers on Wildberries and Ozon (Russian marketplaces) make sense of the platforms’ reports and see their business’s financial picture: sales, profit and cost of goods
Project at a glance
Sellers get marketplace reports in Excel, but the data in them is hard to interpret. WildCRM helps structure this information and use it for management decisions. The client wanted to make working with analytics and moving between sections simpler. The interface also had to be ready for the product’s further growth and for use on mobile devices.
- Sales and profit analytics
- Reports by product and SKU
- Tracking of cost of goods and financial metrics
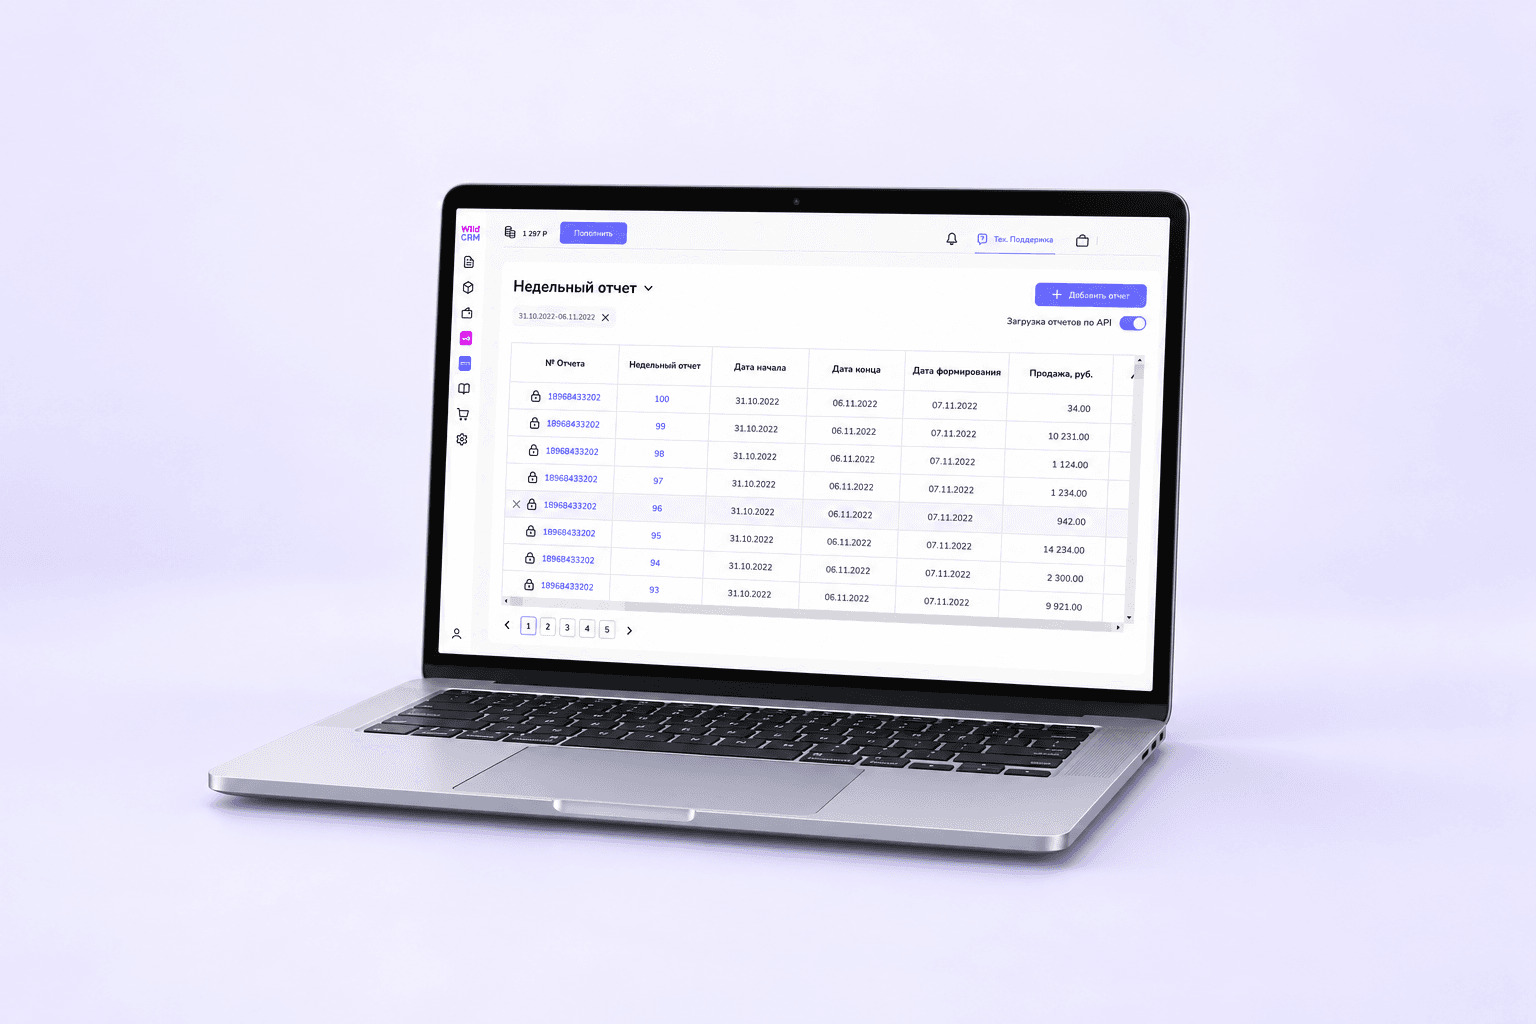
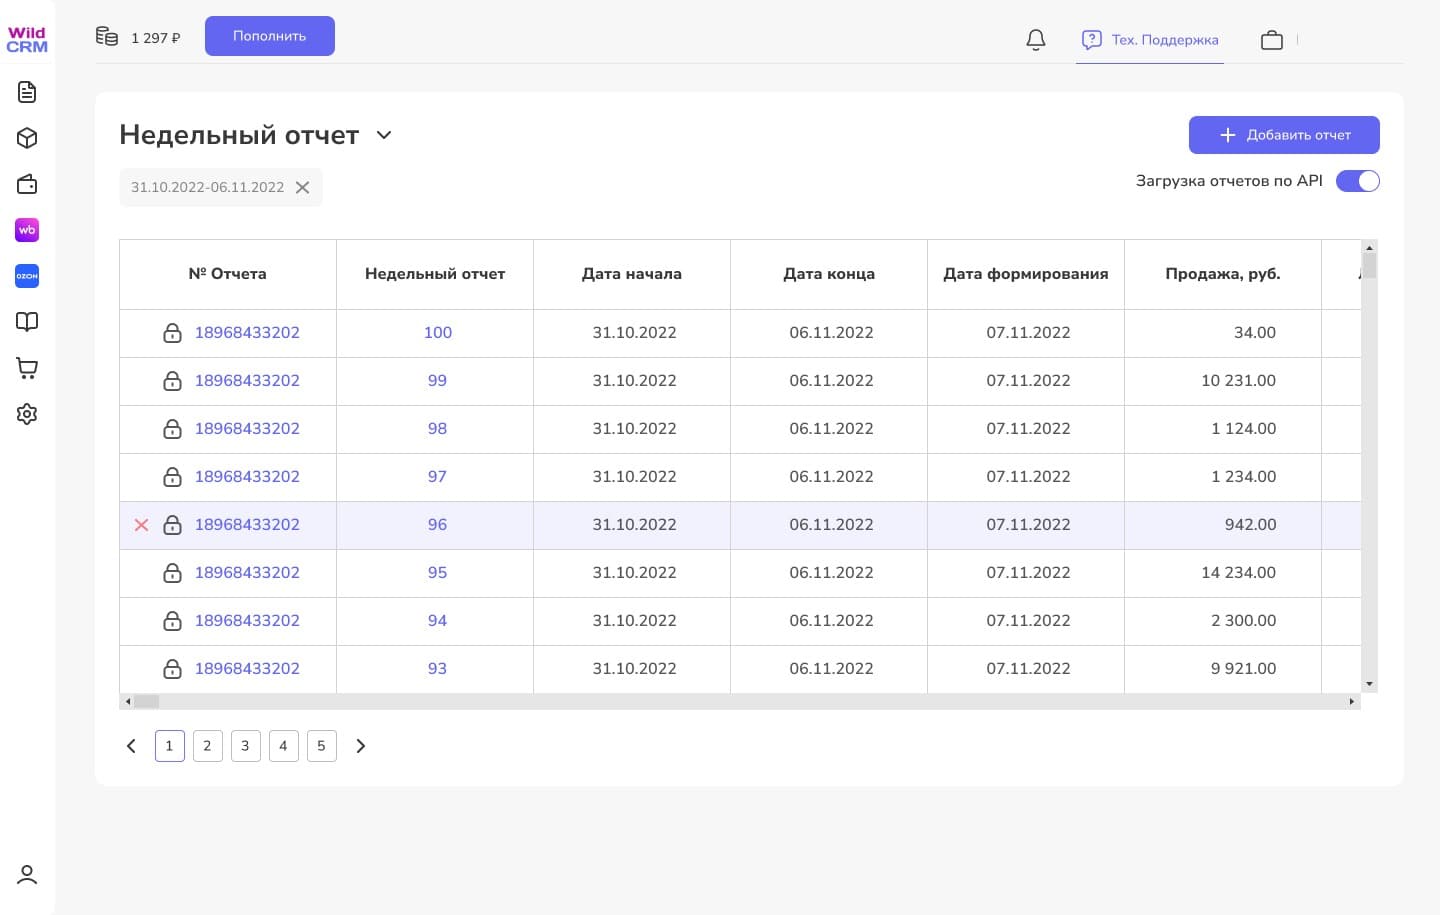
- Weekly report table with periods and sales totals
- Make analytics data easier to work with
- Make navigation clearer
- Prepare the interface for the product’s growth
Want the same for your business? Tell us about your task — we’ll propose a solution and estimate the timeline.
Shared rules for the interface
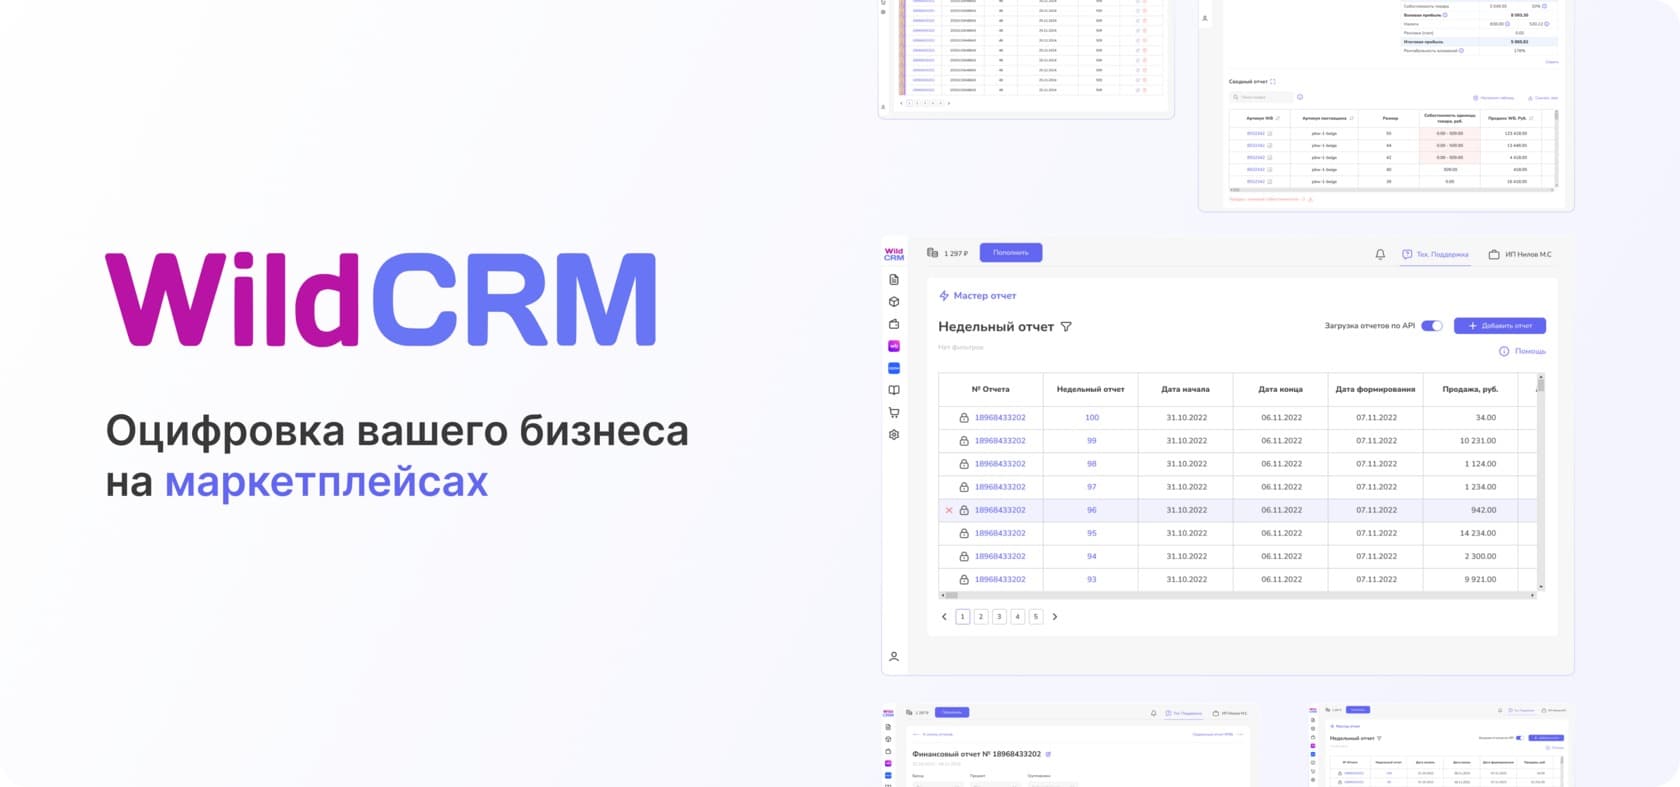
We created a single design system and component library for the WildCRM sections. They became the basis for the redesign and for further work on the interface.
We reworked navigation between sections. We also prepared the service for mobile devices.
Sales, profit and cost of goods
The redesign covered sales and profit analytics, reports by product and SKU, and tracking of cost of goods and financial metrics.
This data helps sellers assess their business’s financial picture: compare sales with costs and factor profit into their decisions.
Weekly reports in one table
In the live service, weekly reports are collected in a table. Next to each report number are the start and end of the period, the date the report was generated and the sales total, so records can be compared without opening each one.
A date filter helps pick the right period, and pagination leads to other records. Above the table are a button for adding a report and a toggle for loading via API.
Target audience
- Marketplace sellers
- E-commerce business owners and staff
- Analysts and finance specialists
What users need
Job to be done — from situation to outcome
I get marketplace reports in Excel, but in that form it’s hard for me to make sense of the data and see my business’s financial picture.
I want to understand how sales and cost of goods affect profit so I can make informed decisions.
I use structured data on sales, profit and cost of goods as the basis for running my business.
What’s inside
Sales and profit analytics
Reports by product and SKU
Tracking of cost of goods and financial metrics
Weekly report table with periods and sales totals
Report filter by date
Pagination for reports
How we worked
Interface design
Redesign of the service’s sections
Building the design system and component library
Adapting the interface for mobile devices
How it looks
Need a similar project?
Tell us about your task — we’ll estimate the scope, timeline and cost and propose a solution.
Other projects
See all projects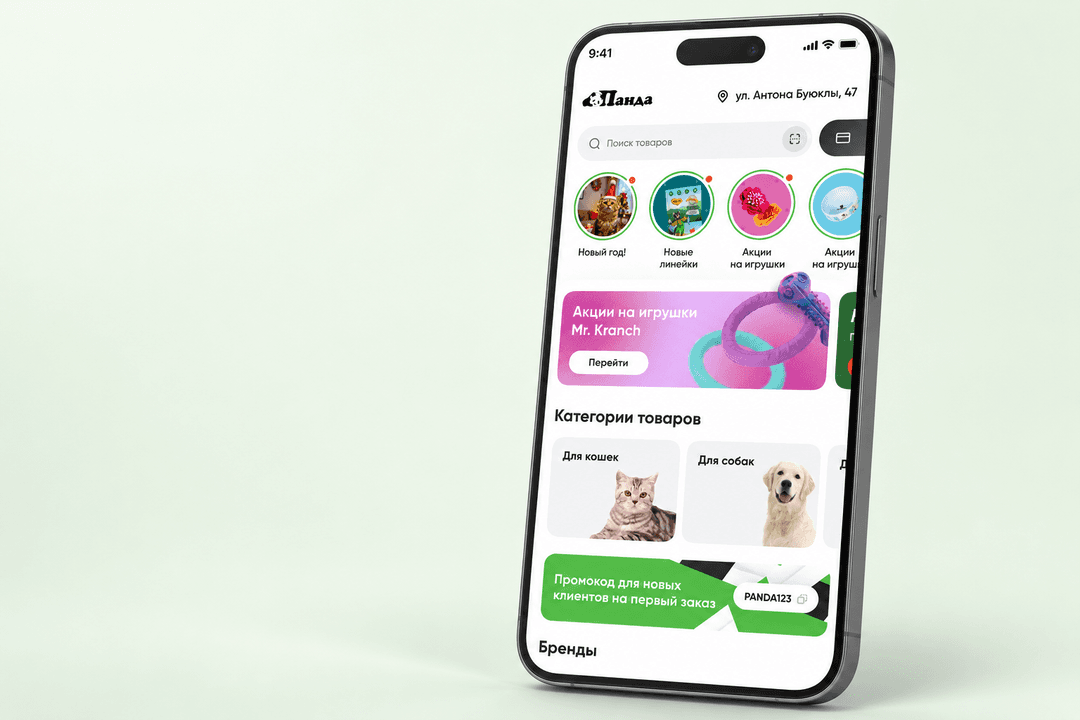
Panda lets a pet store sell through a mobile app and helps shoppers choose food by ingredients and price

The Entersight website helps store owners explore cloud inventory management and start a free trial

The Fiory online store presents the brand’s range and helps shoppers choose food and care products for their pet